

Categories
Market UpdatesPublished November 15, 2026
Ann Arbor Homes Are Selling Slower, and Buyers Have More Choice

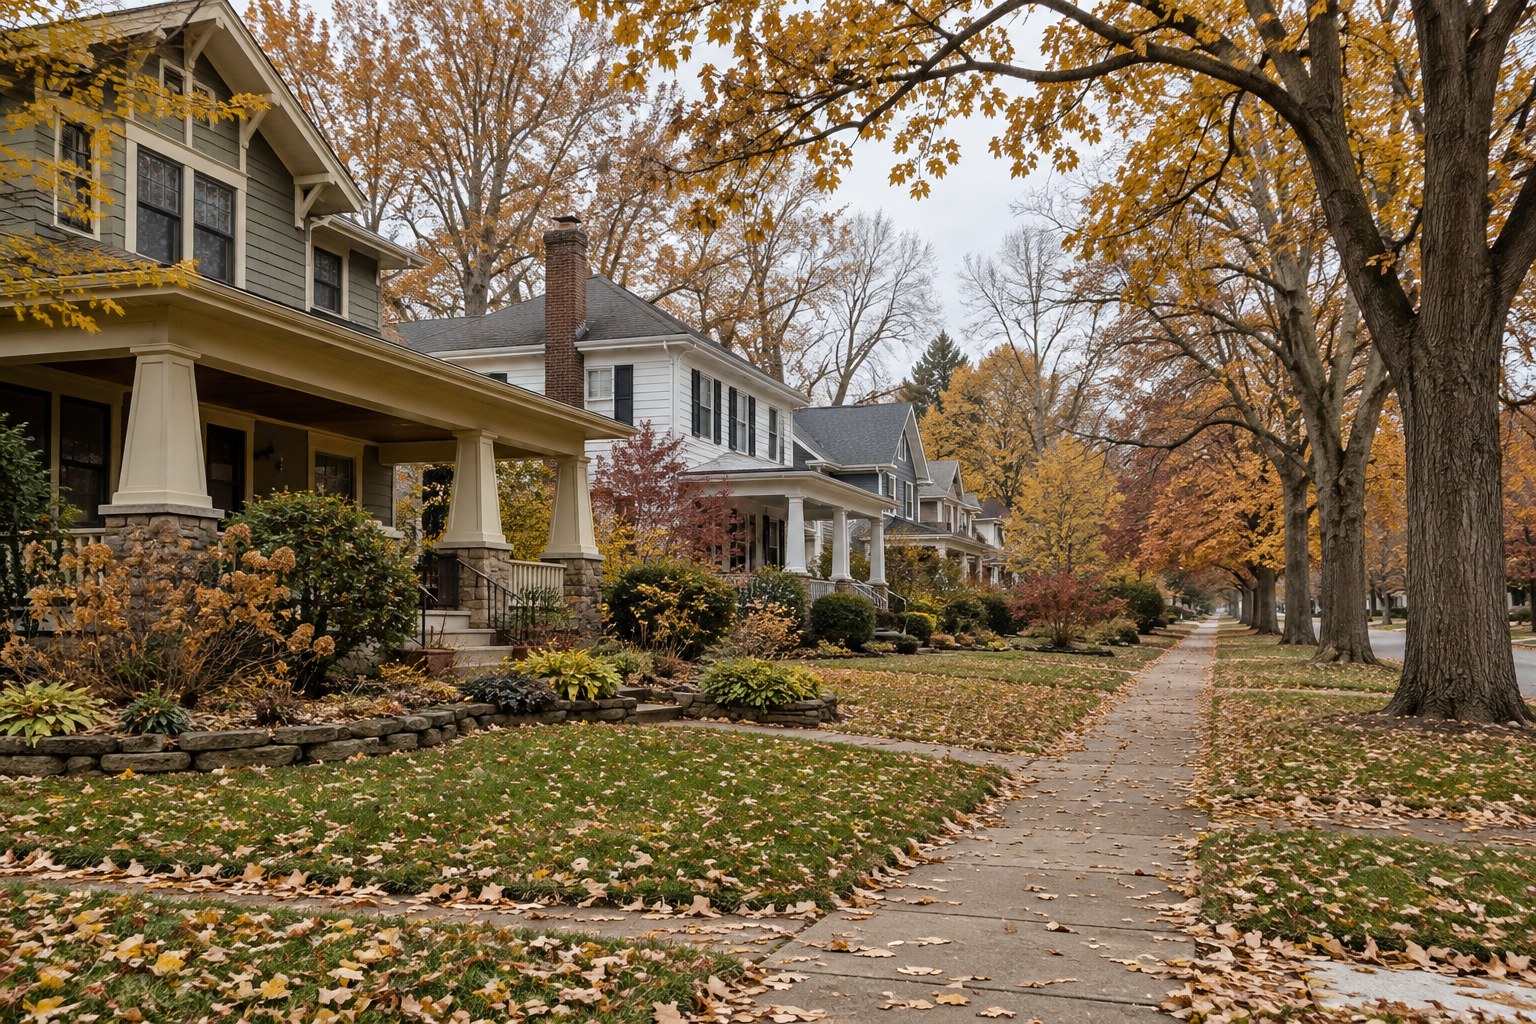
Ann Arbor homes are taking longer to sell this fall, but single-family homes are not selling for less per square foot. With mortgage rates about a point higher than a year ago, October 2026 brought fewer closings, slower sales and more choice for buyers, while value per foot held up.
Here is what closed in the Ann Arbor Public Schools attendance area in October 2026, measured against the same month in each of the last three years. Local figures come from our own MLS data, not a national estimate; where we cite the national market, it is sourced.
The month at a glance
- 91 homes closed, at a median price of $449,000
- Median $283 per square foot
- Median 51 days on market; 26% sold within two weeks
- Sellers netted 97.9% of asking price, and 96.4% of their original asking price
- 419 homes available and 123 already under contract, which is about 4.6 months of supply
Four Octobers: a slower pace
| October | Sales | Median price | $/sq ft | Days on market | Sold above asking |
|---|---|---|---|---|---|
| 2023 | 137 | $450,000 | $264 | 32 | 36% |
| 2024 | 124 | $463,475 | $282 | 18 | 37% |
| 2025 | 110 | $497,500 | $289 | 26 | 20% |
| 2026 | 91 | $449,000 | $283 | 51 | 12% |
The pace changed most. 91 homes closed this October, compared with 110 last year and 137 in 2023, and the median sale took 51 days, about twice as long as last October. Only 12% of sales closed above asking, down from 36% in 2023.
Values held up better than the headline suggests. The overall median fell to $449,000 from $497,500, but that mostly reflects which homes sold this month. Single-family price per square foot actually rose to $306 from $294, and the median house sold for $555,000, compared with $575,000 a year ago.
Supply keeps building
There are 419 homes available in the district against 91 October closings, or 4.6 months of supply, up from 4.0 months in September and 3.1 in August. Another 123 are under contract. 239 of today's listings have been on the market more than sixty days, and 45% have adjusted their price.
That is a healthier, more balanced market than the one Ann Arbor had in 2023 and 2024. Buyers can take the time to look, compare and inspect. Sellers can still do well: homes that came to market well prepared and never needed a price change sold in a median 22 days at 98.1% of their first asking price.
Houses and condos
- Single-family homes: 58 sales, median $555,000, $306 per square foot, 46 days on market
- Condominiums: 33 sales, median $385,000, $247 per square foot, 72 days on market
The condominium median rose to $385,000 from $366,100 last October, but condos are the slower side of the market, taking 72 days to sell compared with 46 for houses. Condo buyers have the most room to negotiate right now, and condo owners should price against current sales in their own association or a comparable one, not the district-wide headline.
Where you are still matters
| Area | Sales | Median price | $/sq ft | Days on market | % of asking |
|---|---|---|---|---|---|
| 48104 · Central / Burns Park | 17 | $739,864 | $425 | 75 | 98.0% |
| 48197 · Ypsilanti (AAPS) | 6 | $619,652 | $209 | 76 | 100.0% |
| 48103 · West A2 / Scio | 31 | $500,000 | $309 | 25 | 97.2% |
| 48105 · North / Northeast A2 | 16 | $480,500 | $246 | 126 | 97.5% |
| 48108 · South A2 / Pittsfield | 20 | $345,750 | $243 | 34 | 99.1% |
48103 (west Ann Arbor and Scio Township) was the busiest and fastest part of the district, with 31 sales in a median 25 days. 48108 (south Ann Arbor and Pittsfield) has the tightest supply at 3.2 months and sold at 99.1% of asking. 48105 (north and northeast) was the slowest this month, at a median 126 days. 48104 is really two markets: its houses sold at a $900,000 median in 48 days, while its condominiums sold at $385,000 in 98 days. A few new-construction downtown condos lift that ZIP's price per foot.
Price range changes the math too
| Price range | Sales | Median price | Days on market | Months of supply |
|---|---|---|---|---|
| Under $300K | 17 | $269,900 | 42 | 5.5 |
| $300K-$500K | 34 | $384,500 | 50 | 4.3 |
| $500K-$750K | 20 | $579,500 | 80 | 4.8 |
| $750K-$1M | 10 | $833,100 | 44 | 3.0 |
| $1M+ | 10 | $1,300,150 | 24 | 5.5 |
Supply runs from 3.0 months between $750,000 and $1 million (only 10 sales, so read it lightly) to 5.5 months above $1 million and 5.5 months under $300,000. Homes between $500,000 and $750,000 took the longest to sell this month, a median 80 days.
How this compares with the country
Nationally, existing-home sales ran at a 3.99 million annual pace in September, down 2.2% from a year ago, according to the National Association of REALTORS®. The national median price rose 1.3% to $417,500, inventory reached 4.8 months of supply, and the typical home sold in 33 days. NAR chief economist Lawrence Yun said, “Higher inventory and lengthening days on market give buyers improved negotiating power.”
Rates are the main reason. Freddie Mac's 30-year fixed rate averaged 7.24% the week of October 29, down from 7.40% in early October but well above 6.17% a year ago. Ann Arbor is following the national pattern: more inventory, slower sales, and values that are mostly holding.
What this means for you
If you are selling
Plan for a longer timeline than a year ago and make the first impression count. With 419 homes for buyers to compare, condition, presentation and a price based on current comparable sales in your own price range and property type matter more than they did in 2024.
If you are buying
You have more room than buyers have had in years. 88% of sales closed at or below asking price this October, and 239 homes have been available more than sixty days. Inspection contingencies, negotiated repairs and seller help with closing costs are realistic again.
If you are just watching
Value per square foot in the Ann Arbor school district is holding. What has changed is the pace: fewer bidding wars, more negotiating, and 4.6 months of supply heading into winter.
Want your own numbers?
District-wide medians are a starting point, never an answer. The right price for your home depends on your street, your price range, your property type, and the condition of the three closest comparable sales. That is a conversation, and we are glad to have it with no obligation.
Call 734-302-3011, or reach out here, and we will put together an honest assessment of what your home would do in this market.
Data source: Trillium Real Estate analysis of MLS residential listings and sales in Ann Arbor Public Schools attendance areas, with data through the end of October 2026 (91 closed sales; inventory as of the November 3 MLS pull), with multi-year comparisons drawn from our matching all-status export back to January 2023. National figures: National Association of REALTORS® Existing-Home Sales for September 2026 (released Oct. 13, 2026); Freddie Mac Primary Mortgage Market Survey, Oct. 29, 2026. Months of supply reflects current inventory against sales in the reporting month. Statistics are provided for informational purposes and are not an appraisal or a guarantee of value. Equal Housing Opportunity.

Sandi Smith
President & Broker | Sandi Smith | Trillium Real Estate
or another way