

Categories
Market UpdatesPublished November 20, 2026
Greater Ann Arbor Market Report: October 2026

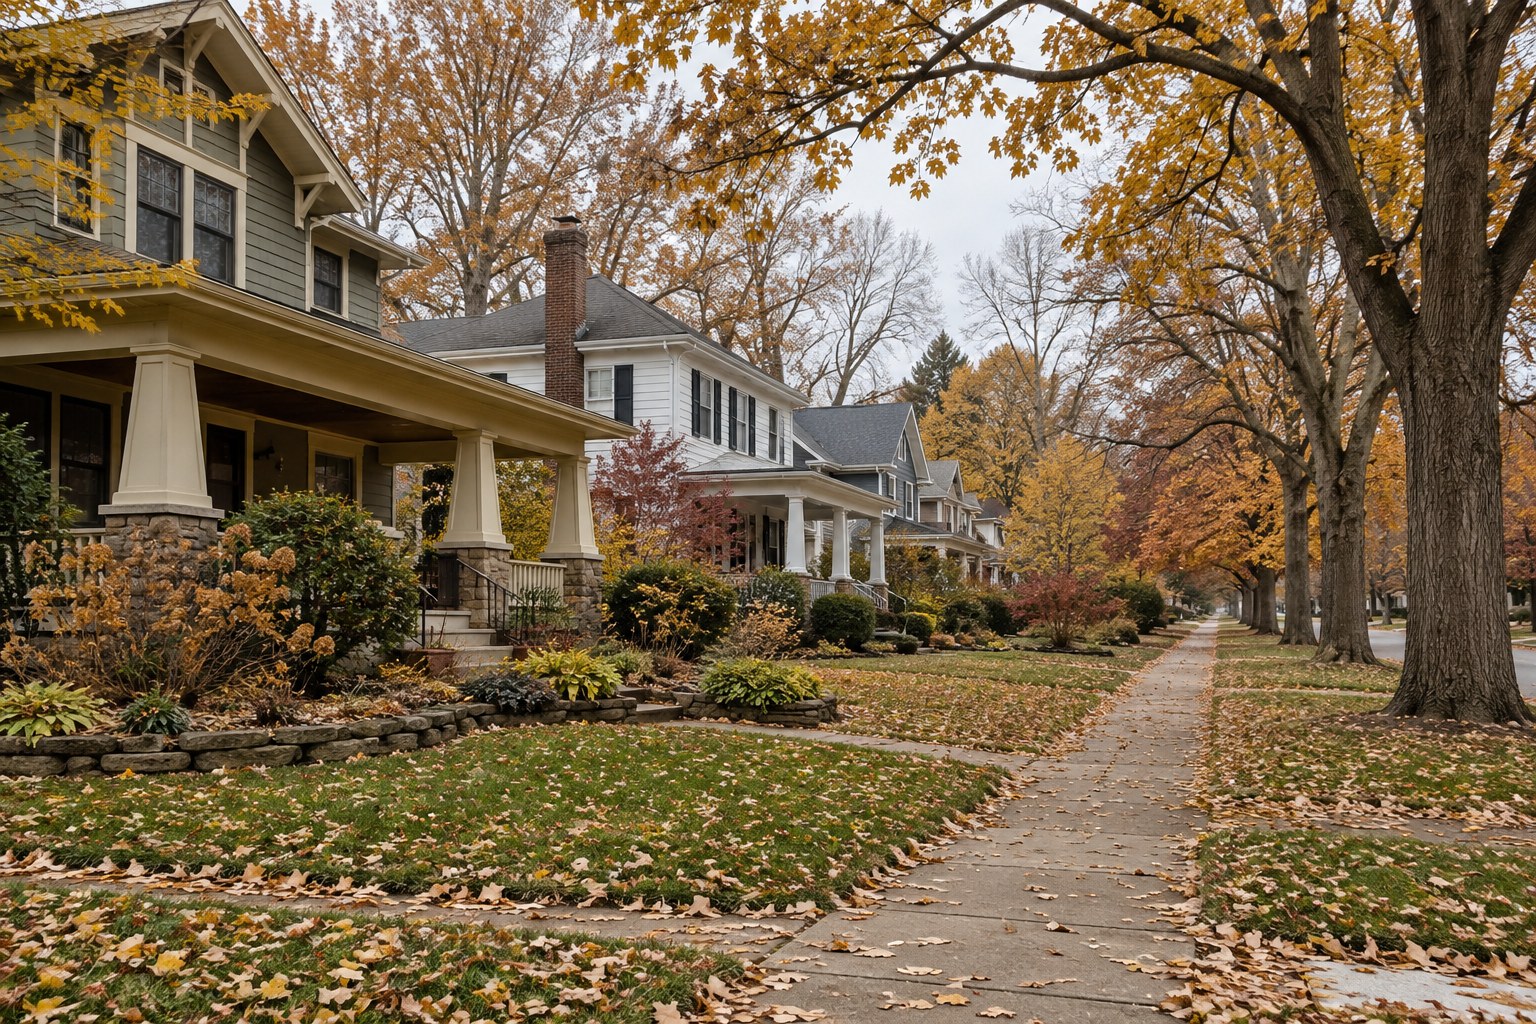
Homes across the Greater Ann Arbor area are taking longer to sell this fall, but values are holding. With mortgage rates about a point higher than a year ago, October 2026 brought fewer closings and more choice for buyers, while price per square foot rose 2.5% from last October.
This report covers residential closings (single-family homes, condos and co-ops) in the 20 ZIP codes we track around Ann Arbor, from Chelsea and Dexter to Saline, Ypsilanti, South Lyon and Northville. Local figures come from our own MLS analysis. Looking for the Ann Arbor school district only? Read our Ann Arbor Public Schools report.
The month at a glance
- 362 homes closed, at a median price of $395,000
- Median $238 per square foot, up 2.5% from October 2025
- Median 30 days on market, compared with 21 a year ago
- Sellers netted 98.7% of asking price; 23% of sales closed over asking
- 1,339 homes available, about 3.7 months of supply
Four Octobers: a slower pace
| October | Sales | Median price | $/sq ft | Days on market | Sold over asking |
|---|---|---|---|---|---|
| 2023 | 459 | $355,000 | $208 | 27 | 34% |
| 2024 | 441 | $415,000 | $234 | 21 | 34% |
| 2025 | 443 | $407,000 | $233 | 21 | 29% |
| 2026 | 362 | $395,000 | $238 | 30 | 23% |
The median price is down 2.9% from last October, but that reflects which homes sold, not falling prices: October buyers bought smaller, lower-priced homes, and value per square foot is up. What has changed most is the pace. Bidding wars are less common, with 23% of sales closing over asking compared with 34% in 2023.
Houses and condos
| Type | Sales | Median price | Days on market | % of list | Months of supply |
|---|---|---|---|---|---|
| Single-family | 276 | $400,000 | 26 | 98.7% | 3.4 |
| Condo / co-op | 86 | $347,000 | 39 | 99.9% | 4.5 |
Condos sold closer to asking (99.9% of list) but took longer to sell, with more supply on the market.
By ZIP code
| ZIP | Area | Sales | Median price | Days on market | Available |
|---|---|---|---|---|---|
| 48103 | Ann Arbor W / Scio | 33 | $500,000 | 24 | 170 |
| 48104 | Ann Arbor central | 17 | $739,864 | 75 | 83 |
| 48105 | Ann Arbor N / NE | 17 | $466,000 | 125 | 91 |
| 48108 | Ann Arbor S / Pittsfield | 26 | $369,000 | 28 | 79 |
| 48111 | Belleville / Van Buren | 28 | $262,450 | 36 | 80 |
| 48118 | Chelsea | 14 | $425,000 | 30 | 36 |
| 48130 | Dexter | 7 | $625,000 | 68 | 53 |
| 48158 | Manchester | 7 | $350,000 | 7 | 28 |
| 48160 | Milan | 11 | $364,170 | 22 | 25 |
| 48167 | Northville | 31 | $649,000 | 26 | 94 |
| 48169 | Pinckney | 19 | $395,000 | 33 | 70 |
| 48176 | Saline | 28 | $440,500 | 51 | 96 |
| 48178 | South Lyon | 34 | $590,000 | 20 | 133 |
| 48189 | Whitmore Lake | 8 | $478,664 | 15 | 32 |
| 48197 | Ypsilanti / Pittsfield | 36 | $364,950 | 24 | 130 |
| 48198 | Ypsilanti | 36 | $235,000 | 21 | 93 |
| 49240 | Grass Lake | 7 | $300,000 | 23 | 34 |
ZIPs with fewer than five October sales (Gregory 48137, Willis 48190/48191) are left out because a handful of sales can swing the median. Ann Arbor ZIPs mix houses and condos, so medians move with the mix.
By price range
| Price range | October sales | Available | Months of supply | % of list |
|---|---|---|---|---|
| Under $300K | 94 | 339 | 3.6 | 98.2% |
| $300K-$500K | 146 | 461 | 3.2 | 99.2% |
| $500K-$750K | 76 | 306 | 4.0 | 98.7% |
| $750K-$1M | 24 | 101 | 4.2 | 98.3% |
| $1M and up | 22 | 132 | 6.0 | 97.5% |
Homes priced $1 million and up are the softest part of the market, with about six months of supply. Expect the most room to negotiate there.
The national picture
Freddie Mac's 30-year fixed rate averaged 7.24% the week of Oct. 29, down from 7.40% on Oct. 8 but well above 6.17% a year ago. Nationally, the National Association of REALTORS® reported a September median of $417,500 (up 1.3% from a year earlier), 4.8 months of supply and 33 days on market. The Greater Ann Arbor area is following the same pattern: more inventory, slower sales and values that are mostly holding.
What this means for you
If you are selling
Plan for a longer timeline than a year ago. With 1,339 homes for buyers to compare, condition, presentation and a price based on current comparable sales in your area and price range matter more than they did in 2024.
If you are buying
You have more choice than buyers have had in years. 36% of available homes have been on the market more than 90 days, and inspection contingencies, negotiated repairs and seller help with closing costs are realistic again.
If you are just watching
Values are holding. What has changed is the pace: fewer bidding wars, more negotiating and 3.7 months of supply heading into winter.
Want numbers for your ZIP code or school?
Area-wide medians are a starting point, never an answer. We can pull numbers for your ZIP code, or in the Ann Arbor Public Schools, down to your elementary school. Call 734-302-3011, or reach out here, and we'll send them over with no obligation.
Data source: Trillium Real Estate analysis of MLS residential sales (single-family, condo and co-op) in 20 Greater Ann Arbor ZIP codes, with data through Oct. 31, 2026 (362 closed sales; inventory as of the Nov. 3 MLS pull), and multi-year comparisons from our matching export back to January 2023. October counts may rise slightly as late-reported sales post. National figures: National Association of REALTORS® Existing-Home Sales for September 2026 (released Oct. 13, 2026); Freddie Mac Primary Mortgage Market Survey, Oct. 29, 2026. Months of supply reflects current inventory against sales in the reporting month. Statistics are for informational purposes and are not an appraisal or a guarantee of value. Equal Housing Opportunity.

Sandi Smith
President & Broker | Sandi Smith | Trillium Real Estate
or another way